Overview
The Resource Projections Utility is used to aggregate and analyze schedule data from project planning. Scheduled hours can be viewed by employee or job title and compared against available hours to show predicted utilization.
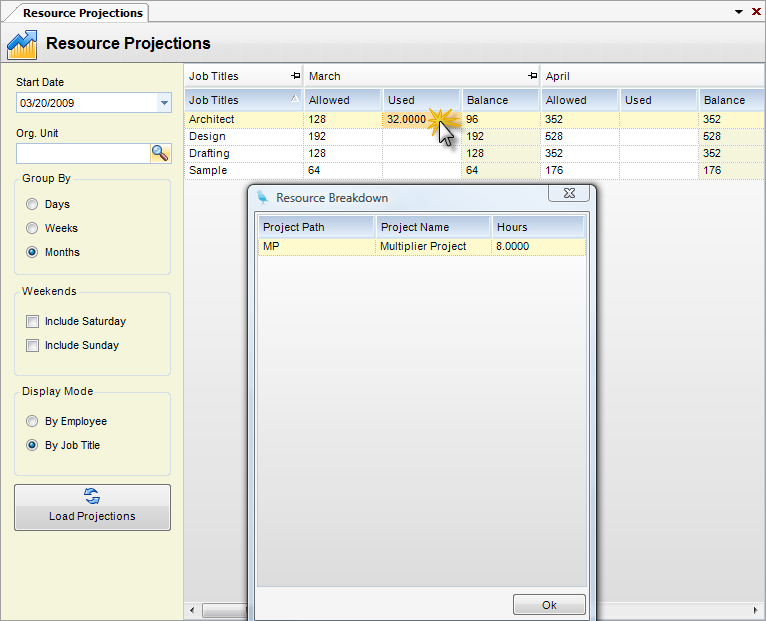
Note 1 - Clicking on used columns will cause a drill-down screen to pop up, displaying the distributions of the hours among the scheduled projects (Fig.1).
Note 2 - The toolbar contains an Export button that gives the user the ability to export the projections to Excel.
Description Below

Fig.1
The grid displays figures for:
| • | Allowed - Number of hours employee or job title can work for a given period of time. |
| • | Used - Number of hours employee or job title has been scheduled for a given period. |
| • | Balance - Allowed Minus Used. There is an option under View in the toolbar to hide this column. |
The following options and filters are available:
| • | Start Date - Starting date for schedules to evaluate. |
| • | Org Unit - Organization unit and its children to include. If left blank, all org units are used. |
Group By
| • | Days - When checked, a scheduled end date of 30 days past the start date will be used. These days will show in the grid. |
| • | Weeks - When checked, a scheduled end date of 24 weeks from the start date will be used. These 24 weeks will show in the grid |
| • | Months - When checked, a scheduled end date of 12 months from the start date will be used. These 12 months will show in the grid. |
Weekends
| • | Include Saturday - When checked, Saturdays will be included. |
| • | Include Sunday - When checked, Sundays will be included. |
Display Mode
| • | By Employee - When checked, projections are by employee. |
| • | By Job Title - When checked, projects are by job title. |