Overview:
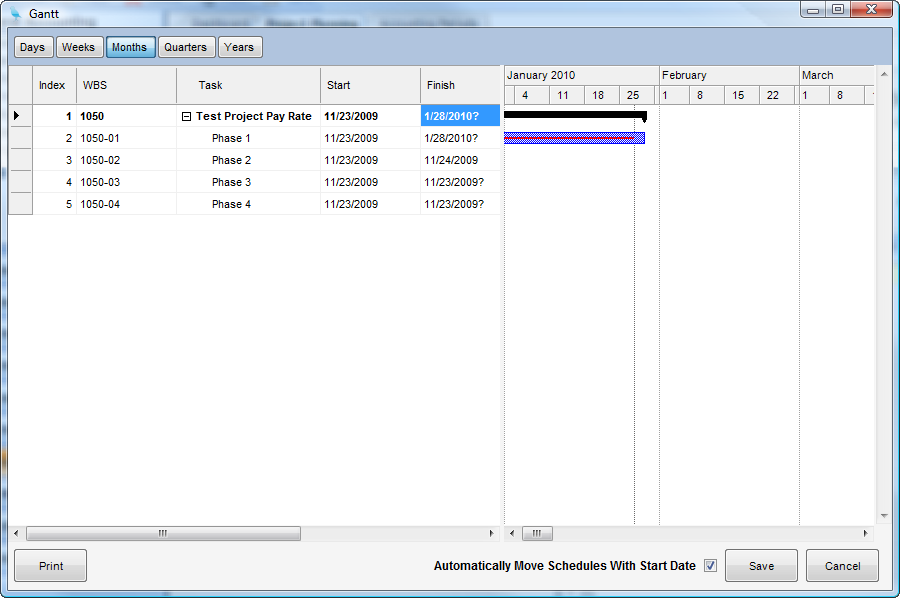
The Gantt Tab displays projects (WBS) dates in an interactive Gantt chart. There are two types of bars: task bars (blue colored) and summary bars (black colored). The task bars can be moved through click and drag operations. The summary bars will automatically follow the task bars, but cannot be moved with a mouse.
Slide a task by clicking and dragging the entire task bar. This will move any associated schedules. Alter the start and end dates of a task by gripping the left or right edge of the task bar and increasing or decreasing its length.
A dotted vertical line may appear in the chart area. This represents the current date. Task bars that occur before this date will have a red line in their center. Tasks that fall on this line will have a red line up to the current date line.
The Gantt chart can be viewed in units of days, weeks, months, quarters, and years. The unit can be changed by clicking on the unit above the chart.
The Gantt chart also controls Allow Schedule Dates. To schedule resources, they must fall within the date boundaries of the Gantt. Dates can be changed manually in the date columns in the grid immediately to the left of the chart.